Menu
Menu
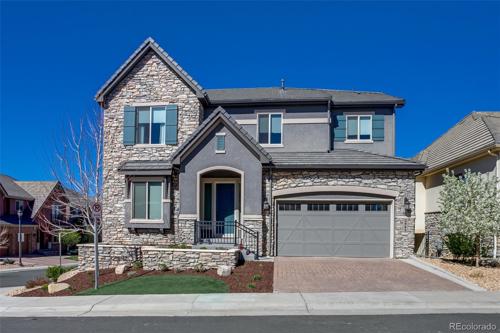
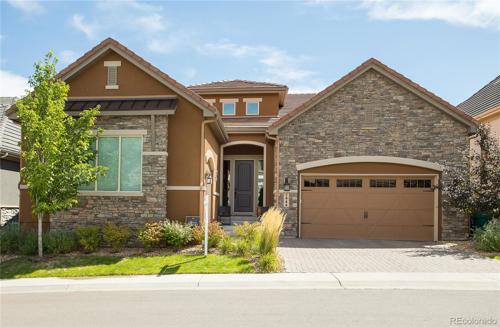
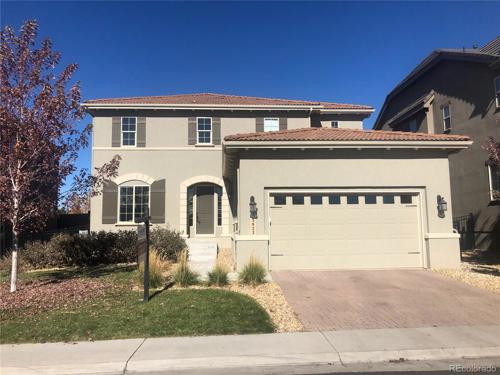
Marvella Homes Centennial, Colorado
Presented by Bill Maher
Marvella Homes Centennial, Colorado
Located in Centennial, Colorado, Marvella is a luxury residential community that provides an exceptional living experience in close proximity to Denver and the Denver Tech Center. Residents of Marvella enjoy a live, work, and play lifestyle, with easy access to light rail and a variety of new homes in different sizes, styles, and price ranges. The community is also within the highly regarded School Creek School District, making it an ideal location for families. Here are the top 5 reasons why to live in Marvella neighborhood:
Ideal Location: Marvella is conveniently located near Denver and the Denver Tech Center, providing easy access to top-rated employers, dining, entertainment, and shopping.
Luxury Living: Marvella features an array of luxurious homes in a range of sizes, styles, and price ranges to suit every lifestyle.
Great Amenities: The community offers a host of amenities, including parks, walking trails, and easy access to light rail, ensuring residents have everything they need for comfortable living.
Highly Regarded School District: Marvella is located within the School Creek School District, which is renowned for its top-rated schools and excellent educational programs.
Thriving Community: With a thriving and diverse community, Marvella offers a welcoming and friendly atmosphere, making it a great place to call home.
List of Zipcodes in Marvella Homes Centennial, Colorado
| Zip Code | Zip Code Name | Zip Code Population |
|---|---|---|
| 80111 | Centennial | 32,120 |
Source: Census Bureau
Demographics
State
Colorado
County
Arapahoe County
City
Centennial
Population
114,508
| Zip Code | City | County | State | National | |
|---|---|---|---|---|---|
| Population | 32,120 | 114,508 | 654,892 | 5,759,582 | 331,426,769 |
| Population Density | 2,982.1 | 3,906.7 | 820.6 | 55.5 | 93.8 |
| Percent Male | 49.0% | 49.0% | 49.0% | 49.0% | 49.0% |
| Percent Female | 51.0% | 51.0% | 51.0% | 51.0% | 51.0% |
| Median Age | 41.6 | 43.7 | 38.9 | 40.2 | 39.0 |
| People per Household | 2.4 | 2.6 | 2.5 | 2.8 | 2.6 |
| Median Household Income | $105,941 | $106,157 | $75,120 | $115,942 | $61,963 |
| Average Income per Capital | $66,136 | $48,805 | $40,034 | $50,725 | $33,235 |
Source: Census Bureau
Market Data
| Zip Code | City | County | State | National | |
|---|---|---|---|---|---|
| Median Sale Price | $650,000 | $510,000 | $402,500 | $425,100 | $277,796 |
| Median Age of Home | 44.0 | 49.0 | 47.0 | 39.0 | 49.0 |
| Homes Owned | 60.0% | 78.0% | 61.0% | 67.0% | 58.0% |
| Homes Rented | 33.0% | 19.0% | 34.0% | 23.0% | 31.0% |
| Homes Vacant | 7.0% | 3.0% | 6.0% | 4.0% | 11.0% |
Sources: Census Bureau / Homendo
Source: REcolorado
This free service is provided by your local Agent
How much is your Home worth? Click here to know...
Review current market value estimates for your home, or anyone else, anywhere in the USA.
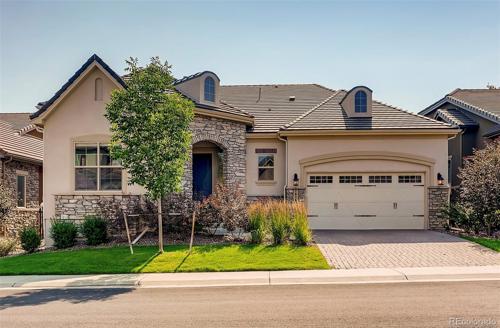
18 properties on market in Marvella Homes Centennial, Colorado
 Active
Residential
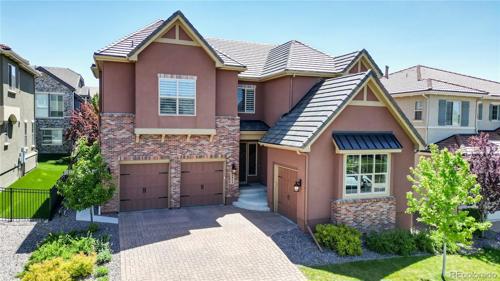
Active
Residential
MLS# 8283392 | 2025-06-29T20:05:20.500Z
 Sold
Residential
Sold
Residential
MLS# 1842667 | 2025-06-23T17:04:16.520Z
 Pending
Residential
Pending
Residential
MLS# 9478943 | 2025-06-21T20:08:16.473Z
 Active
Residential
Active
Residential
MLS# 8288389 | 2025-06-14T03:03:16.322Z
 Sold
Residential
Sold
Residential
MLS# 9547969 | 2024-10-01T21:04:59.493Z
 Sold
Residential
Sold
Residential
MLS# 7075741 | 2024-08-07T15:00:17.587Z
 Sold
Residential
Sold
Residential
MLS# 3891094 | 2024-07-10T21:58:16.250Z
 Sold
Residential
Sold
Residential
MLS# 9541301 | 2024-04-25 16:56:16
 Sold
Residential
Sold
Residential
MLS# 4143858 | 2024-03-26 21:00:24
This free service is provided by your local Agent
Need more listings? Click here to search now...
15 minutes updated and accurate properties direct from your local agent. Home Evaluation. Get Loan Pre-Qualified.

Bill Maher
RE/MAX Professionals
6020 Greenwood Plaza Boulevard
Greenwood Village, CO 80111, USA
6020 Greenwood Plaza Boulevard
Greenwood Village, CO 80111, USA
- (303) 668-8085 (Mobile)
- Invitation Code: billmaher
- Bill@BillMaher.re
- https://BillMaher.RE
Contact Me
Quality of Life
Cost of Living
105.0
Health Cost Index
115.0
Commute Time
19.0
Working from Home
7.0%
| Zip Code | City | County | State | National | |
|---|---|---|---|---|---|
| Cost of Living Index | 105.0 | 111.0 | 102.0 | 110.0 | 100.0 |
| Health Cost Index | 115.0 | 124.0 | 114.0 | 119.0 | 100.0 |
| Commute Time | 19.0 | 24.0 | 25.0 | 25.0 | 24.8 |
| Commuting by Bus | 2.0% | 2.0% | 3.0% | 1.2% | 2.1% |
| Commuting by Carpool | 7.0% | 7.0% | 11.0% | 11.0% | 13.5% |
| Commuting by Auto | 84.0% | 84.0% | 81.0% | 80.0% | 79.1% |
| Working at Home | 7.0% | 6.0% | 4.0% | 5.2% | 4.7% |
Source: Census Bureau
Walk Score®
Source: Walk Score®
Climate & Environment
January Average Low Temperature
15.9 °F
July Average High Temperature
89.5 °F
Annual Precipitation (inch)
18 inches
| Zip Code | City | County | State | National | |
|---|---|---|---|---|---|
| January Average Low Temperature | 15.9 °F | 15.9 °F | 15.9 °F | 13.7 °F | 22.6 °F |
| July Average High Temperature | 89.5 °F | 89.5 °F | 89.5 °F | 77.5 °F | 86.1 °F |
| Annual Precipitation (inch) | 18 in. | 18 in. | 18 in. | 19 in. | 38 in. |
Source: NOAA Climate
Schools & Education
Source: Great Schools
Safety & Crime
Violent Crimes
294.8
Property Crimes
1,176.1
| Zip Code | City | County | State | National | |
|---|---|---|---|---|---|
Violent CrimesCalculated annually per 100,000 residents |
|||||
| Assault | 158.1 | 112.0 | 291.4 | 246.3 | 250.2 |
| Murder | 2.2 | 1.8 | 7.2 | 3.8 | 5.0 |
| Rape | 68.7 | 42.1 | 79.5 | 67.2 | 42.6 |
| Robbery | 65.8 | 25.1 | 164.1 | 63.6 | 81.6 |
Property CrimesCalculated annually per 100,000 residents |
|||||
| Burglary | 242.9 | 240.0 | 461.7 | 348.4 | 340.5 |
| Theft | 327.2 | 1,337.3 | 2,008.4 | 1,858.3 | 1,549.5 |
| Motor Vehicle Theft | 606 | 176.5 | 569.1 | 384.0 | 219.9 |
Source: FBI - Crime Data Explorer

Take a photo of this QR code
to keep this website details